Forex and Non Forex Candle Stick
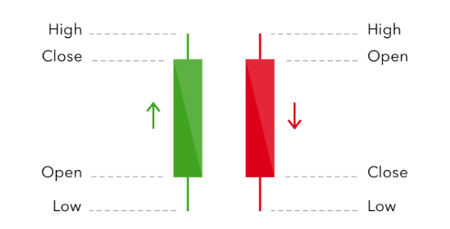
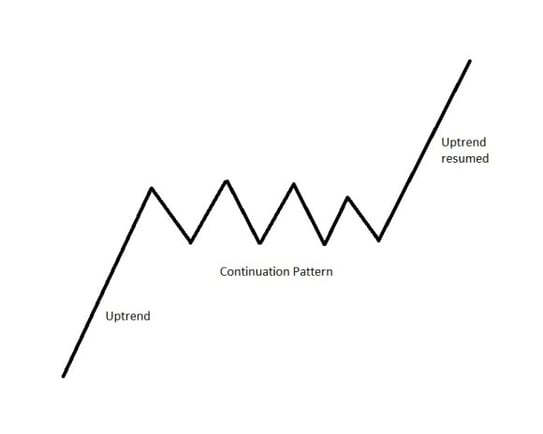
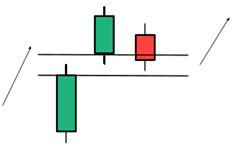
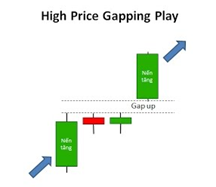
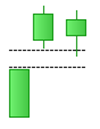
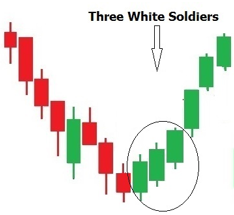
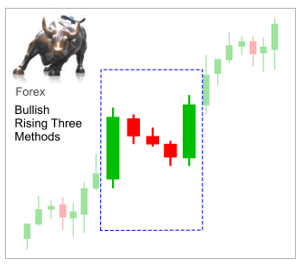
The natural inclination for forex traders is to try and spot price reversals but an under-utilised skill is how to use candlestick continuation patterns to ride a trend further. Candlestick charts are type of price chart that represent the open, close, high and low of a market price over a given period of time and were developed in Japan. Japanese candlesticks are the most popular chart type for forex trading. Japanese rice traders discovered reoccurring patterns in the candlesticks that helped them predict future price changes. These patterns are now established price action trading methods used across all modern financial markets, especially when trading forex. The most popular way of using candlestick charts is to look for candlestick reversal patterns. These are especially useful to confirm when support and resistance levels have held, giving traders a green light to enter a trade. However, the focus on reversal misses some of the best trading opportunities by trading continuations. A recognisable pattern that can be seen on a price chart that has been shown to indicate a continuation of the current price trend. There are two main types of continuation pattern. The first is classic chart continuation patterns and The second is candlestick chart continuation patterns. Classic continuation patterns include things like flag and triangle patterns. Today we are talking about the latter. Rather than being formed across 10-50 candles like a classic pattern, candlestick patterns form across 1-5 candles. This is true of reversals and continuations. Candlestick continuation patterns are a signal that the short term trend over the prior few candles will resume in its current direction. The continuation candlestick patterns are typically characterised by sideways movement after a strong directional move. They represent a pause in a trend where buyers in an uptrend or sellers in a downtrend take a breath. However, this is not always the case since some continuation patterns (such as a gap) are a sign that the trend is accelerating. The concept of a continuation pattern is more in keeping with the idea of trend following. Ie the price has already moved in one direction and the trend follower is looking for opportunities to enter the market and ride the trend further. Although reversal patterns are more well known, the concept is more one of picking tops and bottoms, which tends to be a harder thing to do and is more prone to false signals. Trends will often last longer than many expect, offering a series of forex buy signals or sell signals along the way before finally reversing. The trend is your friend, until its ends! Rule 1: Candlestick patterns alone do not make a profitable trading strategy. If that were the case, we would all be millionaires! Buy signals and sell signals from a random formation of one to three candlesticks alone will generate a lot of false signals. That's because candles are being printed all the time and the chances that three of them will form into one of the known patterns just by accident is very high. Rule 2: Part of what makes a candlestick pattern valid is whether the pattern takes place on a chart. A Trend reversal candlestick is only valid at the end of an established trend. It cannot for example be taken as a valid forex signal in the middle of a sideways range. Continuation patterns are only valid after a trend has started. Rule 3: Candlestick patterns need to be used in conjunction with other analysis. Their best use tends to be as a 'confirmation signal' at a price level determined to be a good entry point by other forms of technical analysis. For example, a trader thinks price will continue to trend higher but there is a resistance level that could cause a reversal. A continuation pattern at that resistance level would act as a confirmation signal that their idea is correct. Of course, the market could still turn lower, but the concept is that the candlestick pattern increases the odds of success. In no special order, here are the 5 best continuation candle patterns to look out for. Gaps are one of the most widely-used and well known short term trading patterns. They are not exclusive to Japanese candlesticks and are often used with traditional bar charts. A bullish gap appears because the open of the second candle is higher than the close of the first candle and the low of the second candle does not reach the close of the first candle. A gap tends to happen at the start of a new trading session due to buyers out numbering sellers while the market was closed. A bearish gap is simply the opposite configuration. This is a 3-bar pattern where there has been a gap between the first two candles and the third candle partially closes the gap. The pattern provides a confirmation that the gap has held as well as a better trade entry point This is a pattern that involves one large body candle and two or three small-body candles with the same high in an uptrend or low in a downtrend that are followed by a gap and another long-bodied candle in the same direction as the first. Similar to the Tasuki gap but the third candle is in the same direction as the first two. This pattern is easy to spot with three long-bodied candles in a row, typically also with short wicks. Three White Soldiers is bullish, while Three Black crows is bearish. Without knowing any better you might think this is a trend that is getting exhausted. However the Japanese candlestick interpretation is that it shows a trend with strong momentum that is likely to continue. This pattern consists of one large body candle followed by three smaller body candles that form in the opposite direction to the first candle. Then a third candle that matches the first candle in size of body and direction. The pattern looks quite distinctive, making it more rare on the charts, which tends to offer a better success rate. A variation of this pattern is called the 'Mat hold'. A variation of this pattern is known as the 'Thrusting line'. This pattern involves two or more matching highs or lows which if broken is a signal that there will be a resumption of the current trend. On a lower timeframe chart this pattern will look like a support or resistance being broken. Breakouts are used by traders a trigger to enter the market with the momentum of the breakout signalling a new leg of a trend. To remember the features of continuation patterns, feel free to print or save this blog as a Candlestick continuation patterns pdf. To practise trading candlestick continuation patterns, register for a free FlowBank demo trading accountJapanese candlesticks
What is a continuation pattern?
What is a continuation candlestick pattern?
Benefits of continuation patterns
Rules to follow with candlesticks
Top 5 candlestick continuation patterns
1) Gaps
Tasuki gap:
Gapping play:
Side by side white lines:
2) Three white soldiers / Three Black Crows
3) Rising Three methods / Falling Three methods
4) Separating lines
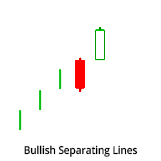
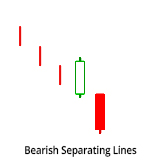 This pattern involves a first candlestick that goes against the prevailing trend and then a second candlestick that opens at the same price as the first candlestick. It is like an internal gap pattern.
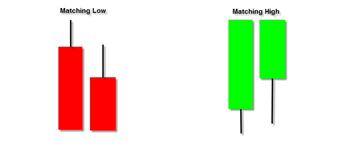
 5) Matching High / Matching Low
Learn Candlestick patterns
Forex and Non Forex Candle Stick
Source: https://www.flowbank.com/en/research/candlestick-continuation-patterns-learn-these-5-for-trading-forex

0 Response to "Forex and Non Forex Candle Stick"
Post a Comment